5 Tips for using Star Data in your Reports and Evaluations

April is here and you may be thinking about putting together project evaluations or preparing your Trustee Annual Report and considering how you demonstrate the impact of your services.

Now is an ideal time to think about using your Outcomes Stars data. Even if you haven’t been using Outcomes Stars for long and don’t have lots of review Stars, read on… you can still use Star data to evidence the need for your service.

In this article we have gathered some tips and ideas to help you use Star data in your annual reports.

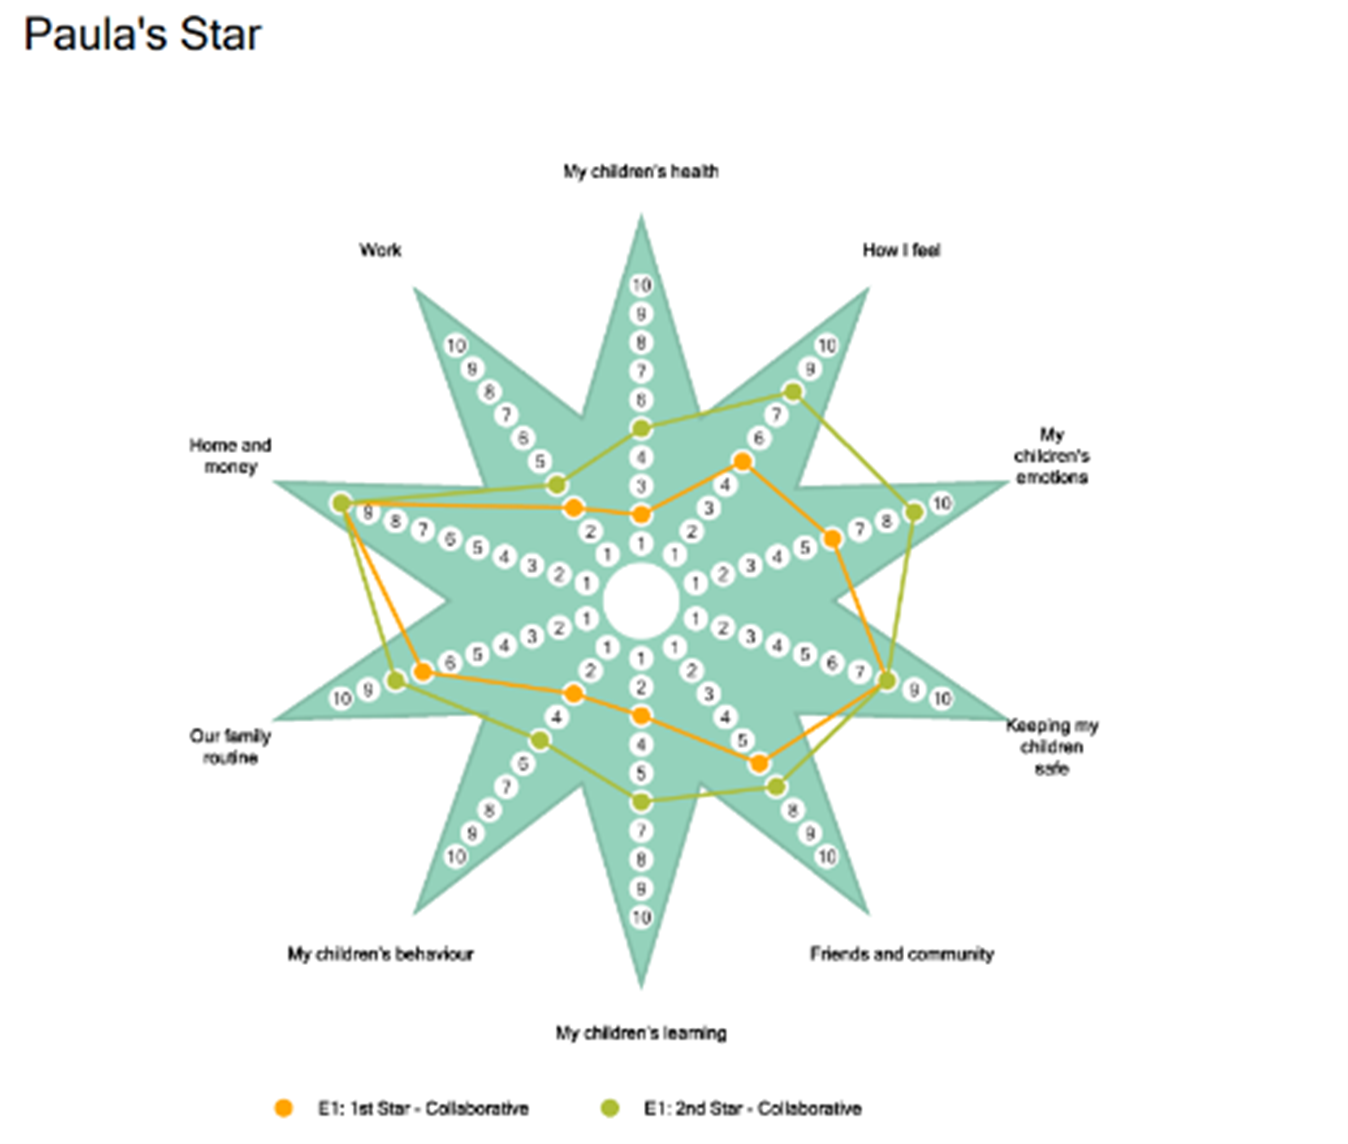
Use Star Charts to bring case studies alive

You probably have lots of stories of amazing personal change achieved by people you support, and already include individual case studies in your annual reporting. You can illustrate this by adding a Star Chart showing someone’s first and last/latest Star readings.

This is a great way to show the changes that have been made. Along with the narrative in your case study, a Star Chart will help you tell the story of how the support provided facilitated progress on the Journey of Change in relevant outcome areas.

TOP TIP

If you don’t use Star Online why not use a photo of your hand-plotted Star Chart image?​

Paula's Star
A Star Chart showing someone’s first and last/latest Star readings

Taking a snapshot view

Snapshot reports look at Outcomes Stars completed across a cohort of people at a particular point in their support. A great way of using a Snapshot report is to look at everyones’ first Stars to see how the readings are distributed across the Journey of Change in each outcome area (by working out the percentage of people with readings at each Stage, in each outcome area). This will give you a profile of the needs people have when they first start support.

TOP TIP

Use this information to illustrate why you deliver the kind of interventions that you do – this can show that your service is evidence led and is focusing resources where they are needed most.

A snapshot report

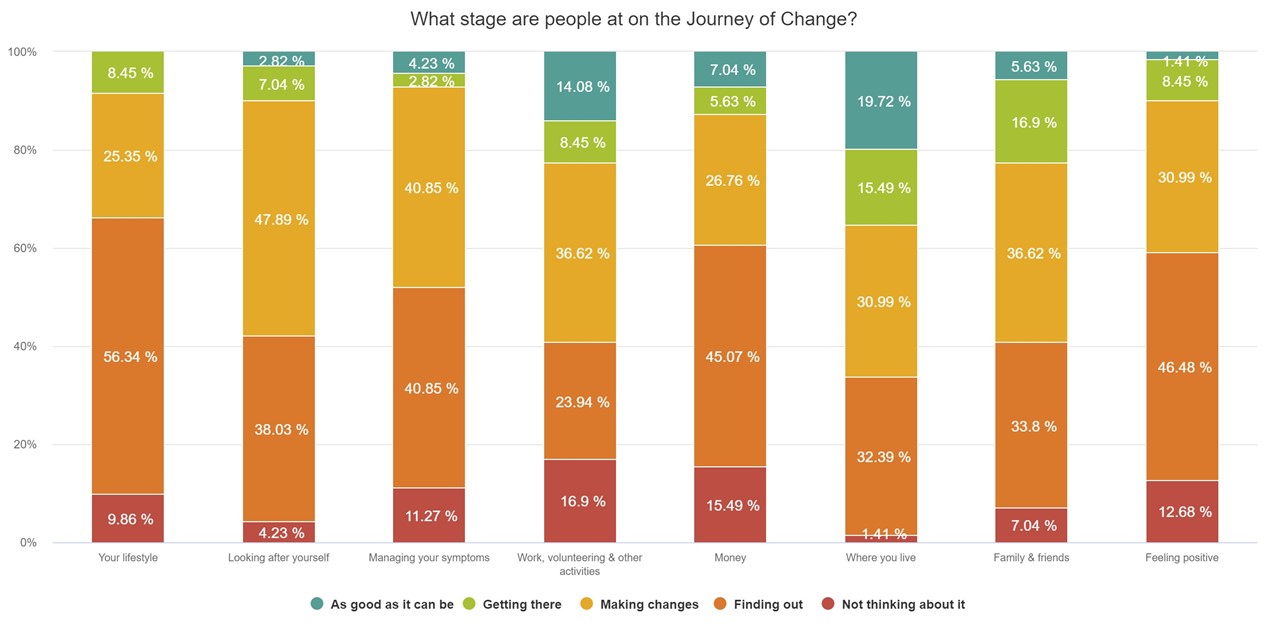
Example of how an organisation may use a Snapshot (SS) report:

We use the Wellbeing Star™ to help us identify people’s needs when they start the three-month social prescribing programme. Over 60% of our programme participants are either not yet thinking about or finding out about how they could improve their lifestyle, so our programme focuses on one to one and small group work to help people open up about their lifestyle and consider the impact this might have on their existing health conditions.

Illustrating the distance travelled

Outcomes Stars are designed to show the progress made by the people you support, and it is really satisfying to be able to collate Star readings to show this progress across a service or organisation. If enough people have completed two or more Stars, readings can be collated for a service or organisation to capture distance travelled and demonstrate the percentage of people that have moved forward, maintained or dropped back over the course of a year.

How much progress are people making in each outcome area?
A distance travelled (DT) report

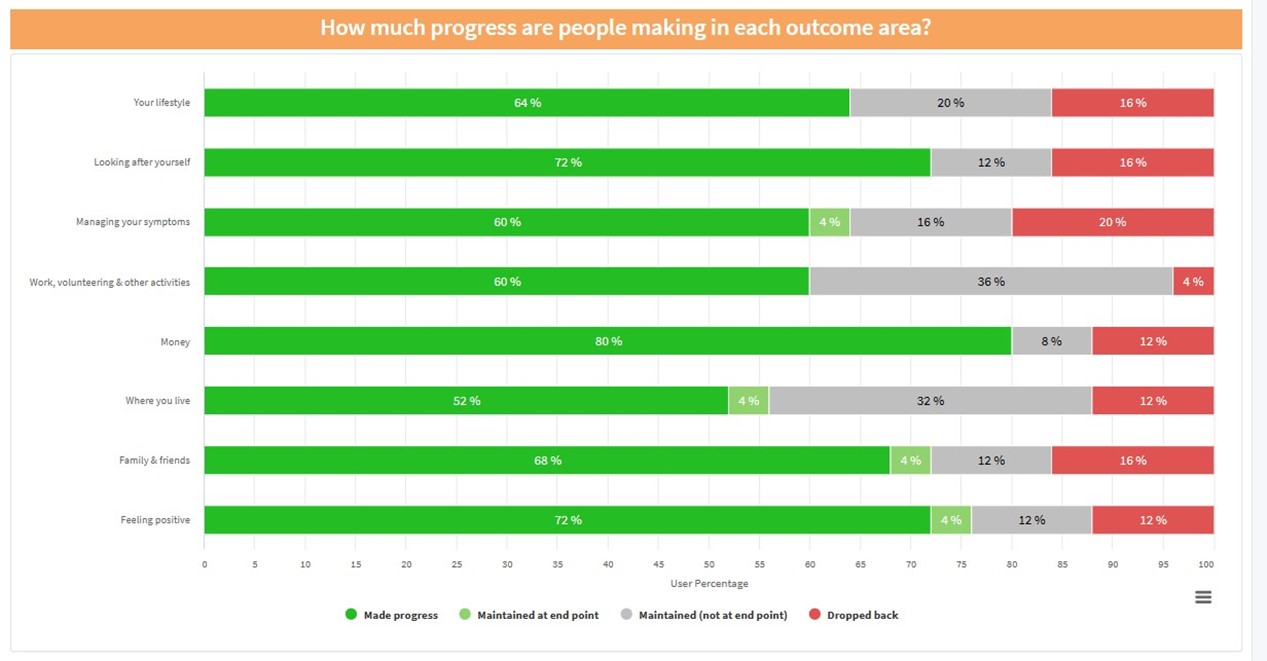
In your report narrative, you might want discuss progress made across all outcome areas around the Star or you might prefer to focus your narrative on a few areas that your service targets through your interventions, by selecting a few headline figures from the data in the report.

Example of adding narrative to a Distance Travelled (DT) report:

As evidenced by our use of the Well-being Star™, which we complete with participants on our social prescribing programme, 80% of participants made positive change in the area Money, following our successful collaboration with our local CAB debt and benefits service – this is a big improvement from the previous year, where Money was the area in which we saw significant need (people were at the lowest two stages of the Journey of Change scale) and we saw the least positive change.

TOP TIP

Explain what your distance-travelled data is showing you, the learnings that have been taken from this and include plans for service delivery going forward based on the findings.

Don’t be afraid to report on people dropping back, maintaining or acknowledging change that isn’t as strong as you would like. Some areas do take longer to make positive change or depend on resources that aren’t available or are out of the control of your service. Reporting on this will show to stakeholders that you understand the data you are getting from Outcomes Stars and that you use it to reflect on your provision and the wider context you work in.

For example:

Although we continue to see less positive change in the outcome area Where you live on the Wellbeing Star™, this is an area where it is often difficult to achieve results within the 3-month programme e.g. referrals to the Council’s aids and adaptation team for an assessment typically take about 10 weeks.

TOP TIP

When using Outcomes Stars to evidence your impact, use the correct title of the Star you use and use the ™ to show you are using a recognised evidence-based Outcomes measurement tool.

Further support

Triangle is here to support you to make the most from your Star data. If you need any support or have any questions, get in touch with your main point of contact at Triangle.

We run regular webinars to help you get the most from your Star data and use the Star Online report dashboards. You can book a slot and find out more information about our webinars below.

Share your practice with Triangle

We would love to see examples of where you have used your Outcomes Stars data to evidence your impact or where you have learnt something interesting – please get in touch to share your experience of using Star data.

Making integration work for organisations using Outcomes Stars™

With our Integration Pilot well underway, we’ve got some news about its future as well as some reflections on what we’ve learnt so far.

Extending Integration Pilot for Outcomes Star Online to December 2024

To ensure we can fully trial the API endpoints and put our design decisions to the test in as many different scenarios as possible, we are extending our Integration Pilot through 2024.

This will mean organisations using the Outcomes Star Online can access and use our Partner API free of charge through 2024, to integrate with any other primary software they use.

A recap on our Partner API for Outcomes Star Online

Outcomes Star Online’s Partner API went live in April 2023, and since then we’ve had conversations with around 50 different organisations about how it can work for their practitioners, other stakeholders and of course, the people they support.

The design of our Partner API is based on these desired outcomes:

  • Any and all primary software that can use APIs can use our API.
  • Outcomes Stars are completed on our platform using our visual and engaging interface aligned with best Star practice.
  • Data-entry and login duplication is reduced as much as possible to make life easier for practitioners.
  • We support a single point of truth and easy access to key Outcomes Star data within the primary software.

We plan to continue to develop and expand our Partner API – in this initial stage, we have 3 key features available, plus Single Sign On for both Microsoft and Google (NB SSO will be launched separately for all Outcomes Star organisations in January 2024 – watch this space!):

Summary of progress so far

With many early-stage conversations underway, we have made some exciting progress including:

  • A sandbox build with a person-centred care planning software provider and a dynamic Northern Ireland-based charity
  • A sandbox build with a team of developers making a custom solution for an innovative education charity
  • Analysis and planning projects with a number of leading UK national charities, mostly working with their own custom software or Microsoft Dynamics platforms

We are hoping to onboard more organisations into the sandbox and link up to the Live environment in early 2024

What’s next for Outcomes Star Online integration

Interoperability is a completely new area for our organisation, and we’re still learning about its challenges and opportunities!

For example, there are lots of questions we are still asking ourselves and looking to learn more about:

  1. Can we develop and maintain ‘middleware’ solutions that remove the burden of custom code on the primary software/client organisation side – for example, for ‘enterprise’ platforms like Salesforce and Dynamics, and for the bigger sector-specialist platforms that provide their own APIs?
  2. For UK NHS settings, should we be focusing on direct integration with individual pieces of software used in a region, or should we be focusing on Shared Care Record integration?
  3. Our current endpoints don’t include an individuals Star data in ‘raw data’ format (it is available in a user-friendly PDF or in aggregated data formats.) How can we provide this in a way that adds value and is usable by different primary software?

If you are working on your own interoperability opportunities and challenges, or if you have any insight or information you could share about the above, please do get in touch.

Evidence that the Star accurately reflects change occurring during service provision

We are sometimes asked whether changes in Star readings actually reflect the changes that occur during service provision. We have three responses to this: the first two are based on the practices we have in place for the development of new Stars and for training and implementation of the Star. The third is to present the research evidence that the Star readings can be applied accurately and that readings correlate with other measures in the expected way.

  1. Star Development
    • New versions of the Star are created alongside managers and practitioners to ensure the Journey of Change captures key changes occurring for those using services.
    • Pilot data is statistically analysed to check that the scales are sensitive enough to detect change.
    • Service users and practitioners provide end-of-pilot feedback about the extent to which the Star captures the changes made.
  2. Training and Implementation
    • For the Star to accurately reflect change, practitioners should be well-trained with ongoing support to continue using it well. This is why training is mandatory, we provide free CPD for licensed trainers and encourage refresher training, regular supervision, and auditing.
  3. Research Evidence
    • Convergent validity: Star readings have been shown to correlate with other validated measures in our own, as well as in external peer-reviewed research.
    • Predictive validity: Star readings, and change in Star readings, predict hard outcomes such as securing accommodation, employment, and school absenteeism
    • Inter-rater reliability: different practitioners are able to consistently assign Star readings

We are keen to conduct further analyses of the relationship between Star readings and other measures, so please get in touch if you have linked data and are interested in us exploring it.

To read our three page briefing providing a more detailed version of the above, please download it here (PDF).

Making change visible: The Outcomes Star captures important achievements that could be missed by focusing on hard outcomes

As the creators of a suite of measures capturing distance travelled towards ‘hard outcomes’ we are sometimes asked whether there is evidence that Star readings correlate with or predict outcomes such as offending or employment. In some cases, we hear there is resistance to using the Star and instead commissioners, managers or funders are only interested in how many service users have ticked the box of meeting these hard outcomes. This misses out on capturing important achievements, ignores the role of internal change in maintaining concrete achievements and disincentives working with those most in need of support.

This briefing describes some of the evidence we have of the ‘predictive validity’ of the Star – that it does in fact predict outcomes such as school attendance, employment, training and accommodation status. This includes findings reported in two articles recently published in peer-reviewed journals.

In it, we also explain the value of the Outcomes Star in measuring the full journey leading up to and including changes in behaviour or circumstances.

The author of this briefing, Dr Anna Good, draws on her expertise in behaviour change theory to summarise the strong evidence base supporting the importance of the changes assessed by the Star. It is clear from the research literature (and our extensive experience of working with service providers), that early steps on the Star’s ‘Journey of Change’ such as acknowledging problems and accepting help are often essential to subsequent change in hard outcomes. Moreover, change in skills, confidence and beliefs are often key factors in the maintenance of life-changing improvements.

****

Please download our new briefing, ‘The Outcomes Star captures important achievements that could be missed by focusing on hard outcomes’.  If you would like more information or support about the use of Star data, please get in touch with us at info@triangleconsulting.co.uk or +44 (0) 207 272 8765.

The Outcomes Star as a management information tool

The Outcomes Star is well established as a tool for supporting effective keywork and demonstrating achievements. Here, 'Triangle's Research Analyst, Dr Anna Good, discusses a third benefit, the opportunity for internal learning. This new briefing describes how Star data can be used to improve service delivery.

Learning from Star data at all levels of the organisation

Over three-quarters of Outcomes Star users in our client survey said Star data reports were ‘useful for learning how their service was ‘doing’ and ‘helpful in managing or developing the ‘service’. Indeed, Star data can provide meaningful management information at all levels, from a service manager reviewing a single ‘worker’s caseload to a senior management team reviewing data aggregated across services. 

Alongside other data (e.g. satisfaction surveys, output and process data), Star data reports, such as those available from our upgraded Star Online System, allow organisations to ask increasingly focused questions about what is happening with the people they support.

Managers can gain essential insights by looking at differences in starting points and change across outcome areas, client groups, and service settings.  Because these insights are likely to be greatest when compared against prior expectations, Triangle has produced resources to support ‘Star data ‘forecasting’.

Learning from Initial Star readings

The distribution of first Star readings provides a valuable overview of people’s needs coming into the service. Star readings can be compared against expectations to ensure that service users are entering the service appropriately and are offered suitable interventions.

An excellent example of the use of first readings is in Staffordshire County Council, where they look at start readings to see if the families are at the right level of service. In our interview with the Commissioning Manager at the time, she told us that “if we have families in our Family Intervention service that have readings of five, I look a bit deeper to see if we’re really using our resources correctly”.

Learning from change in Star readings

Movement in Star readings for each outcome area also provides an opportunity to learn where things are going well and when further exploration of service delivery may be warranted. 

For example, if one service shows different outcomes to another service, this is a starting point for further investigation:

  • Is there other evidence that one service facilitates better outcomes than another?
  • Are there reasons why one service might be supporting people better than another?
  • Is the service user profile different in the different services?
  • Is practice significantly different in that service, and might there be lessons for other services?

A more in-depth analysis of the movement from each Journey of Change stage is also possible, offering more significant potential for learning than typical numerical outcome scales. Managers can explore which stage transitions are happening frequently and where there may be blockages to making other transitions. For example, a service may be very good at helping service users to begin accepting help but struggle more with moving them towards greater self-reliance, limiting the progress currently being made. Specific changes to service delivery might then need to be developed.

*****

Please download our new briefing, ‘The Outcomes Star as a management information tool for more detail on how Star data reports can be used to improve service delivery. If you would like more information or support about the use of Star data, please get in touch with us at info@triangleconsulting.co.uk or +44 (0) 207 272 8765.

The Star Online reporting dashboard: an introduction

Want to know how to create charts, and data driven reports to support funding and measure your impact?
What will it cover?

This short session is an introduction to the main reports dashboards available on the Star Online. It will cover key functions including filters, engagements and how to create instant and engaging report charts to support funding bids, reports and clearly illustrate progress made by service users and also how the Stars are being used across the service.

Who is it for?

This short session is designed to support managers and other staff who use the Star Online.

When is it?

This session will be held online, via Zoom, on September 14, 2021 10:00am (London)

How do I book my place?

If you are a client, manager or interested in knowing more, book your place via Zoom here.

Need to know more?

Contact us or your Implementation Lead for more information.

*****

Please note: this session is not a substitute for official training and will only be relevant to those who are using the Star Online.

Better outcomes for refugees

The genesis of the Integration Star

In a follow-up to our webinar introducing the Integration Star, research analyst Dr Anna Good tells the story of how the new Star for refugees came into being.

Help for refugees to integrate into this country has long been under-resourced and patchy. Specialist refugee organisations are doing brilliant work, but many other services struggle to work out how best to support refugees. And until recently, there’s been little in the way of solid outcomes data that can help shape service delivery.

It’s this context that spurred the creation of the Integration Star – a tool for services working with refugees that enables both better conversations and better outcomes.

The new Star has come out of an exciting and timely meeting of minds. For some years, Triangle had been interested in developing a Star for refugees. “It was on our radar, and several refugee organisations had said it would be great to have an Outcomes Star,” says Triangle director Sara Burns. “I could see it could really work. But because refugee support services tend to be small organisations and quite poorly funded, there was never the support necessary for the collaboration.”

“So I was delighted when in 2018 the Refugee Council approached us and said they wanted to collaborate on a Star. They’d just received a tranche of European funding for a refugee integration programme, and as part of that they had undertaken a commitment to collaboratively create a tool for refugee integration.”

The wider integration and employment programme, New Roots, was led by the Refugee Council in partnership with organisations in Yorkshire and Humberside, and has supported some 2700 refugees, often with complex and multiple needs. In our recent webinar, Better Conversations, Better Outcomes, Refugee Council head of integration Andrew Lawton explains that this programme gave the organisation an excellent opportunity ”to consider how we assessed the impact of our services, not just for the Refugee Council but also for its clients and for others working in the same space”.

“We had often felt that there was more we as an organisation could do to demonstrate a consistent way of measuring an individual’s progression as a result of our support,” he says.

At the time, the Home Office was working on a new framework to support its integration strategy, Indicators of Integration. However, that didn’t include a practical tool for service delivery organisations to measure outcomes. So the participants in the New Roots programme decided to collaborate on a tool that could work for people providing help on the ground, aligned with the Home Office Indicators of Integration.

“We wanted to work towards a set of outcomes that could be used across a range of front line services and that could be shared with other services doing similar work,” says Andrew Lawton.

The Refugee Council was already aware of the Outcomes Stars and approached Triangle about a new Star for refugees. And so the collaboration – between Triangle, the Refugee Council, four New Roots partners and ten refugee community organisations – was born.

These organisations formed the expert committee that helped develop the outcome areas and Journey of Change for the Integration Star. As research analyst at Triangle, I carried out an initial literature review around important outcome areas for working with refugees and mapped these onto the domains in the Home Office’s framework. This research was used to inform Triangle’s tried and tested iterative process of working closely with managers, practitioners and service users to draft and refine the new version of the Star.

“The result? ‘An evaluation tool that places the beneficiary at the centre of their own journey.’”

Throughout the process we were careful to make sure that new Star could work both for refugees arriving through a government resettlement programme and for those who enter the asylum process after arrival. While resettlement refugees receive a package of support that starts with meeting them at the airports and encompasses finding accommodation and providing day-to-day integration casework, the same specialist support doesn’t exist for other refugees. “It’s left to refugee support organisations and the wider voluntary sector to intervene depending on capacity, funding and services they have available,” says Andrew Lawton.

The result of the collaboration? In Andrew Lawton’s words, “an evaluation tool that places the beneficiary at the centre of their own journey, providing them with a tool that is visual, that helps them recognise their own achievements, and really track their own progress with the support of an adviser”.

Following extensive testing and revision, the final version of the Integration Star was published in autumn last year.

“It was a long time coming,” says Sara Burns. “But we’re delighted it happened – it’s a really important tool for the refugee sector.”

Collaborators in developing the Integration Star 
The Refugee Council
RETAS (Refugee Education Training Advice Service), Leeds
PATH Yorkshire
Humber Community Advice Services (H-CAS)
Goodwin Development Trust.

10 community refugee organisations
Leeds Refugee Forum, Refugee Action Kingston, Iranian Association, Diversity Living Services, Bahar Women’s Association, Action for Community Development, West Yorkshire Somali Association, DAMASQ, Stepping Stone 4 and Leeds Swahili Community.

*****

The Integration Star was published at the end of 2020. A separate version, for unaccompanied asylum-seeking children, the Planning Star, was published in July 2020. Both Stars are available to all organisations with a Star licence and training is available for workers and managers. Contact us for more information on info@triangleconsulting.co.uk or +44 (0) 207 272 8765.

Equality in Evaluation

It is an exciting time to be part of the world of measurement and evaluation. Having attended three conferences this autumn, it is clear that those with a critique of the traditional ways of doing things are finding a voice, and being given a platform. In the wake of Black Lives Matter everyone seems more open to looking deeper into the implicit assumptions that we make about each other, and along with that, into the power dynamics of measurement and evaluation. 

NPC ignites was one of these events and it was the session “Rebalancing data for the 21st century” that really captured my attention. Jara Dean Coffey, Director of the Equitable Evaluation Initiative presented a five-year plan she is leading to change the way funders in the United States think about evaluation. Bonnie Chui of The Social Investment Consultancy is leading an initiative bringing together people of colour working in evaluation. Here were some of their key messages:

Co-create knowledge rather than extract data

Traditional approaches to the evaluation involve experts collecting data and taking it away to analyse and draw conclusions. The subjects of the evaluation are passive in the process. Bonnie described this as like using research as tool of ‘command and control’. Jara argued, like several others I have heard this year, that we learn more when knowledge is co-created – researcher and subject bringing together their very different expertise to build a more complete and informed picture. This is one way to challenge the power relationships in evaluation and promote greater equity. The Outcomes Star’s collaborative approach to measurement brings these ideas alive in day-to-day service delivery. 

What is the Outcomes Star

The Star is underpinned by three values – empowerment, collaboration and integration

Get comfortable with complexity

“We need to let go of causality and be OK with contribution”

Star Data

The Star collects an innovative and holistic dataset

Jara made the case that although funders who commission evaluations want certainty and yes/no answers, the complex reality of service provision can’t be reduced to a few numbers.  Funders and evaluators need to embrace the complexity that comes from working in open systems where it isn’t possible to control all the variables and come up with answers that are always true no matter what the context. Bonnie also made the point that top down funder-driven monitoring and evaluation frameworks can perpetuate power imbalances. It is difficult for funded organisations to raise these issues because of their dependence on the funders so it is important that evaluators use their influence. This very much echoes points we have been raising at Triangle for some time. Data is helpful but must be interpreted in context. The numbers help to focus our questions rather than providing definitive yes/no answers. 

De-colonise evidence

Bonnie Chui argued that we need to ‘decolonise’ evidence and ensure that people of colour are both reached by research and represented in the research and evaluation community.   Jara is promoting multi-cultural validity alongside statistical validity, a point which chimes with issues Triangle has raised about moving beyond traditional formulations of what is a ‘good’ tool (keep an eye on our homepage for a blog on this coming out soon).

Both presenters made the case that evaluation is a human process. Those doing the evaluation have to do their own personal work to understand their own implicit biases as well as those that are hardwired into the context in which they are working. The biases identified were racial ones as well as foundational ideas such as the preference for doing over being and our belief in scarcity rather than abundance.

I found it very inspiring to hear an analysis connecting up racism, core orientations towards life and the way services are valued and measured. I can’t do it all justice here, so I recommend that you take a look at the recording of the session.

***

Triangle is the social enterprise behind the Outcomes Star™. Triangle exists to help service providers transform lives by creating engaging tools and promoting enabling approaches. To talk to Joy MacKeith or another member of the Triangle team, or for any other information, please email info@triangleconsulting.co.uk.

The Missing Middle Way: How Management by Results can help us not just measure, but also improve outcomes

Joy MacKeith argues that Payment by Results can cause as many problems as it addresses.  Management by Results, which supports ongoing learning and collaboration, is the missing middle way between ignoring outcomes on the one hand, and linking them to financial incentives on the other.

In early September I was privileged to participate in the fifth Social Outcomes Conference, organised by the Government Outcomes Lab at Oxford University. Contributions from both academics and practitioners from all over the world made for a very rich debate in which everyone had their eye on the prize of improving social outcomes.

The debate got me thinking about the limitations of Payment by Results and an alternative – an approach I am calling Management by Results.  This blogpost explains the difference between the two and how Management by Results has the potential to unlock performance improvement.

Why I am a fan of an outcomes approach

In the old days we didn’t measure outcomes.  We counted inputs and outputs.  We collected case studies.  Occasionally we commissioned evaluations or user surveys.  Then came the outcomes revolution.  I have been part of that revolution, spending much of the last 20 years helping organisations to measure their outcomes.

I am a fan because I have seen that defining, measuring, and managing outcomes enables service providers to create services with a clarity of purpose, identify issues and gaps, and ultimately improve what they deliver for service users. It undoubtedly is a good thing for organisations to focus on outcomes.

But what happens when financial imperatives are introduced into the equation?  What happens when a project or organisation’s survival becomes dependent on evidencing that they have achieved certain outcomes?

Why I’m wary of linking outcomes with financial incentives

In the employment sector where Payment by Results (PbR) has been in operation for some time the consequences are quite well documented (Hudson., Phillips, Ray, Vegeris & Davidson, 2010[1]).  Organisations can be incentivised to focus narrowly on the specific targets which are linked to payment and ignore everything else.

This can lead to a narrowing of their work with individuals (just making sure they get a job rather than working on longer-term issues such as addiction or mental health problems that are likely to impact on their ability to keep the job for example).  It can lead to short-termism with less focus on long-term impact and sustainability.  It can lead to ‘cherry picking’ of clients who are most likely to achieve the target (also called ‘creaming’) and not ‘wasting resources’ on those who are not likely to achieve the target within the timescale of the project (also known as ‘parking’).

The fact that there are widely used terms for these kinds of gaming practices reflects the fact that these perverse incentives are widely recognised and understood. In the financial sector Goodhart’s Law[1] that any financial indicator that is chosen by government as a means of regulation becomes unreliable is well accepted. In the words of the anthropologist Marilyn Strathern “When a measure becomes a target, it ceases to be a good measure”.[2]

In addition to this, there are other more subtle but nevertheless powerful impacts.  In Triangle’s work helping organisations to measure their outcomes we have seen time and again that when the impetus for this measurement is commissioner requirement, the organisation is likely to see outcomes as something that is done for the commissioner rather than something they own.

The result is that the quality of the data collected is poorer and the service provider just passes it on to the commissioner rather than mining this outcomes gold for learning and service development.  This is very unfortunate because sending outcomes information to commissioners doesn’t improve outcomes, whereas using it to better understand delivery does.

Another impact of PbR is that it focuses attention on the work of the service provider in isolation as opposed to looking at how the service delivery system as a whole is working. In practice often it is the network of service provision that achieves the outcome rather than a single provider.

Finally, in the market for social outcomes, providers find themselves in competitive rather than collaborative relationships, which can make system-wide cooperation and information sharing more difficult.

The missing middle way
There were several speakers at the recent GoLab conference who argued that financial incentives can work – if they are done well.  I am writing primarily from personal experience rather than extensive research and I trust that what they say is true.  I am also aware myself of PbR contracts and Social Impact Bonds that have been sensitively implemented with all parties understanding the risks and the funding mechanisms carefully designed to build the right incentives.

My concern is that too often the approach isn’t done well and also that the alternative of MbR is not recognised and considered.  In our enthusiasm to embrace outcomes we have gone from one extreme of not talking about or measuring outcomes at all, to the other extreme of linking payment to outcomes.  Between these two poles there is a middle ground – a third way which can unlock the potential of outcome measurement without so many of the downsides.

So what does Management by Results look like and how is it different from Payment by Results?

The Management by Results mindset
Both MbR and PbR involve identifying and measuring outcomes.  But in MbR the emphasis is on the service provider using this information in the management of the service to identify strengths, weaknesses and issues to be addressed.  Whereas in PbR the emphasis for the service provider is on using the information to secure the funding the organisation needs to survive.

For commissioners MbR means requiring the service provider to measure their outcomes and then drawing on that information to assess their performance.  But crucially in MbR the commissioner draws on other information as well and has room for judgement.  PbR is black and white.  Target achieved = good, payment made. Target not achieved = bad, no payment made.

MbR allows for greater subtlety and a more rounded assessment.  The commissioner looks at the data, but they also look at the organisation’s narrative about the data.  Is it a coherent narrative? Are they learning from their data and using the lessons to improve service delivery?  What do others say about the service?  What do you see if you visit and what do service users have to say?

The commissioner draws on all this information to make their assessment.  Of course, life would be a lot easier if you didn’t have to do this and could reduce a project’s effectiveness to a few numbers.

But you can’t.

There is always a wider picture, for example in the employment sector, what is happening in the service user’s personal life, what is happening in the local economy, what other services  the person is receiving and what impact are they are having. The numbers have a part to play but they are never the whole answer.

How Management by Results changes the questions and supports learning
An organisation that is managing by results will take a systematic approach to collecting and analysing outcomes data and will then use that data for learning and accountability.  The job of the manager is to ask: “Why did this work – what good practice can we share?”  and “Why didn’t this work, what do we need to change and where can we learn from others?”

The job of the commissioner or investor is to assess “Is this organisation taking a sensible and systematic approach to measuring its outcomes? And is it learning from its measurement and continually changing and improving what it does?” PbR encourages hiding of poor results and exaggeration of positive results as well as the creaming and parking described above.  This positively hinders learning and obscures what is really happening.

MbR encourages collaboration between service provider and commissioner in identifying and achieving their shared goals.  PbR obscures these shared interests by incentivising service delivery organisations to prioritise their own survival.

The table below summarises the differences:

Payment by ResultsManagement by Results
A black and white approach.  Achieving the target is assumed to equate to successRecognises the complexity of service delivery and that success must be interpreted in context
Payment is linked to achievement of targets.  There is no room for skilled judgement or for considering wider contextual informationOutcomes information is placed in a wider context.  There is room for skilled judgement
Obscures the shared goals of commissioner and service provider and encourages service providers to focus on organisational survivalEmphasises the shared goals of service provider and commissioner and encourages the provider to focus on achieving intended outcomes
Encourages a gaming culture because service providers are assessed on whether they have met the targetBecause service providers are assessed on whether they are using outcome measurement to address issues and improve services it encourages a learning culture
Service providers are incentivised to withhold information from commissioners and even falsify dataService providers are incentivised to share information and learning with commissioners and problem solve together for the benefit of clients

Management by results is not easy but it is worth the effort

Management by Results is not easy.  At Triangle we support organisations to implement the Outcomes Star and in practice this means that we are supporting them to build a MbR approach.  This involves forging new habits, behaviours and organisational processes, creating new interdepartmental links, new reports and new software.

It isn’t easy and it takes time, even for the most willing and able.  But we also see the benefits for those that stick with it – managers with a much better handle on what is happening in their services, who can pinpoint and address issues and share good practice as well as evidence achievements.

I believe that if the sector put more energy, funding and research into supporting organisations to manage by results, it would really start to unlock the potential to not only measure, but also improve outcomes.

What do you think?

[1]Hudson, M., Phillips, J., Ray, K., Vegeris, S., & Davidson, R. (2010). The influence of outcome-based contracting on Provider-led Pathways to Work (Vol. 638). Department for Work and Pensions.

[2] Goodhart, C.A.E. (1975). “Problems of Monetary Management: The U.K. Experience”. Papers in Monetary Economics (Reserve Bank of Australia

[3] http://www.atm.damtp.cam.ac.uk/mcintyre/papers/LHCE/goodhart.html

***

Triangle is the social enterprise behind the Outcomes Star™. Triangle exists to help service providers transform lives by creating engaging tools and promoting enabling approaches. To talk to Joy MacKeith or another member of the Triangle team, or for any other information, please email info@triangleconsulting.co.uk.

Psychometric testing of the Outcomes Star

The Outcomes Star has been tested psychometrically. A new set of psychometric factsheets demonstrate the validity of the Outcomes Star, and reveal how the Star can produce informative and valuable outcomes data for commissioners, funders and organisations.

Psychometric testing tells us how confident we can be in the data produced by a measurement tool including whether it measures what it claims to measure and produces consistent scores.

Triangle has published a set of factsheets to demonstrate the psychometric properties of every version of the Star. We are also in the process of having an article validating the Family Star Plus published in a peer reviewed journal. Dr Anna Good has produced a psychometric factsheet for each of the Outcomes Stars, providing the findings from a number of these tests. She explains a bit more about the process and importance of the ensuring the Stars are tested psychometrically.

At its essence, validity means that the information yielded by a test is appropriate, meaningful, and useful for decision making” (Osterlind, 2010, p. 89).

Psychometric validation has been used in some form for over a hundred years. It involves tests of validity (usefulness and meaningfulness) and reliability (consistency), for example:

  • expert opinion about the content of the measure
  • clustering of ‘items’ or questions into underlying constructs
  • consistency across the readings produced by each item
  • consistency across ‘raters’ using a tool
  • sensitivity to detect change over time
  • correlation with, or predicts of, other relevant outcomes

Why is it important to test the Star psychometrically? What are the benefits of testing the Outcomes Star?  What’s the background to the research?
Triangle recognises the importance of having ‘evidence and theory support the interpretations of test scores’ (AERA, APA & NCME, 1999, p.9), both because we are committed to creating scientifically sound and useful tools and because policy advisors, commissioners and managers require validated outcomes measures and want assurance of a rigorous process of development and testing.

The validation process is an important part of the development of new versions of the Star – we need to know that the outcome areas hang together coherently, whether any outcome areas are unnecessary because of overlap with other areas or have readings that cluster at one end of the Journey of Change.

Once there is sufficient data, we also conduct more extensive psychometric testing using data routinely collected using the published version of the Star. This is beneficial for demonstrating that the Star is responsive to change and that Star readings relate to other outcome measures, which is important both within Triangle and for evidencing the value of our tools externally.

What was involved in producing the psychometric factsheets?
The initial validation work for new Stars is conducted using data from collaborators working with Triangle during the Star development and piloting process. It involves collecting Star readings and asking service users and keyworkers to complete questionnaires about the acceptability and how well the Star captures services users’ situations and needs.

The further testing of the published version uses a larger sample size of routinely collected Star data and assesses the sensitivity of the Star in detecting change occurring during engagement with services. Whenever possible, we collaborate with organisations to assess the relationship between Star readings and validated measures or ‘hard outcome measures’ such as school attendance.

We have also been working to assess consistency in worker’s understanding of the scales using a case study method. This method is described fully in an article published in the Journal of Housing Care and Support (MacKeith, 2014), but essentially involves working with organisations using the Star to develop an anonymised case study or ‘service user profile’, and comparing the readings assigned by trained workers with those agreed by a panel of Star experts. The findings tell us how consistent and accurate workers in applying the Star scales when given the same information. 

Conclusion: An evidence-based tool
The Outcomes Star is an evidence-based tool. The development of new Stars follows a standardized and systematic process of evidence gathering through literature reviews, focus groups, refinement, initial psychometric analyses and full psychometric testing using routinely collected data.

Psychometric validation is useful in the development of new Stars and to provide evidence that the Outcome Star can produce data that meaningfully reflects the construct it is designed to measure.

Organisations can use Triangle’s psychometric factsheets alongside peer reviewed articles to demonstrate the validity of the Outcomes Star to funders and commissioners, and to have confidence that provided it is implemented well, the Star can produce informative and useful data.

Interested in finding out more about psychometrics testing and the validity of the Star?
Take a look at our research library. For more information on the key terms and to read the psychometric factsheets please read the Psychometrics Overview or visit www.outcomesstar.org.uk/about-the-star/evidence-and-research/star-psychometrics. Contact Triangle at info@triangleconsulting.co.uk for more information.

*****

References:

American Educational Research Association, American Psychological Association, & National Council on Measurement in Education. (1999). Standards for educational and psychological testing (4th ed.). Washington, DC: American Educational Research Association. 

Mackeith, J. (2014). Assessing the reliability of the Outcomes Star in research and practice. Housing, Care and Support, 17(4), 188-197.

Osterlind, S. J. (2010). Modern measurement: Theory, principles, and applications of mental appraisal (2nd ed.). Boston, MA: Pearson Education.

*****

Dr Anna Good: Dr Anna Good is a Research Analyst at Triangle: a large part of her role involves testing the psychometric properties of the Star, conducting research and supporting organisations to make the best use of Star data. After completing an MSc and a PhD in Psychology with specialisms in behaviour change interventions and psychological research methods, Anna spent a number of years as a post-doctoral researcher, including two years as principal investigator on a prestigious grant examining health behaviour change.

For more information on evidence and research into the Star please visit our Research Library or contact us: email Triangle at info@triangleconsulting.co.uk, or call on +44(0)202  7272 8765.